Download sample data here: wg_sample_data.zip
library(ape)

# modified from
# http://the-praise-of-insects.blogspot.fi/2010/04/transitions-in-r-redux.html

par(mfcol=c(1,1)); par(mar=c())
par(xpd=F, mar=c(5,4,4,2)+0.2, family="Palatino")

#Input: dat---an object of class 'DNAbin'

titv<-function(dat){
  mat<-as.matrix(dat)
  res<-matrix(NA, ncol=dim(mat)[1], nrow=dim(mat)[1], dimnames=list(x=names(dat), y=names(dat)))
  for(i in 1:(dim(mat)[1] - 1)){
    for(j in (i+1):dim(mat)[1]){
      vec<-as.numeric(mat[i,])+as.numeric(mat[j,])-8
      res[j,i]<-sum(!is.na(match(vec,c(200,56))))#Transitions
      res[i,j]<-sum(!is.na(match(vec,c(152,168,88,104))))#Transversions
    }
  }
  res
}

create_plots<-function(files) {
  for( i in 1:length(files)) {
    codon <- as.DNAbin(read.nexus.data(files[i]))

    ti<-titv(codon)
    tv<-t(ti)

    if (i == 1) {
      R1 <- ti[lower.tri(ti)]/tv[lower.tri(tv)]
      dist1 <- dist.dna(codon, model="JC69", gamma=T, pairwise.deletion=T)
    }
    else if( i == 2) {
      R2 <- ti[lower.tri(ti)]/tv[lower.tri(tv)]
      dist2 <- dist.dna(codon, model="JC69", gamma=T, pairwise.deletion=T)
    }
    else if( i == 3) {
      R3 <- ti[lower.tri(ti)]/tv[lower.tri(tv)]
      dist3 <- dist.dna(codon, model="JC69", gamma=T, pairwise.deletion=T)
    }
    else {
      print("error")
    }
  }
  # print plot
  xname = expression("JC+" * Gamma * "corrected distances")
  yname = "Transition/Tranverstion ratio"
  plot(NA, xlim=c(0,.6), ylim=c(0,40), xlab=xname, ylab=yname, main="Saturation plot for Wingless gene")
  points(R3~dist3, xlim=c(0,.6), ylim=c(0,40), col="red", pch=20, xlab="", ylab="")
  points(R1~dist1, xlim=c(0,.6), ylim=c(0,40), col="grey", pch=20, xlab="", ylab="")
  points(R2~dist2, xlim=c(0,.6), ylim=c(0,40), col="cyan", pch=20, xlab="", ylab="")

  legend.txt <- c("1st position", "2nd position", "3rd position")
  legend.colors <- c("grey",  "cyan", "red")
  legend("topright", legend.txt, pch=19, col=legend.colors, title="wingless", cex=0.9)
}


files <- c("wg_1.nex", "wg_2.nex", "wg_3.nex");
create_plots(files);
Y este es el resultado final para el gen wingless:
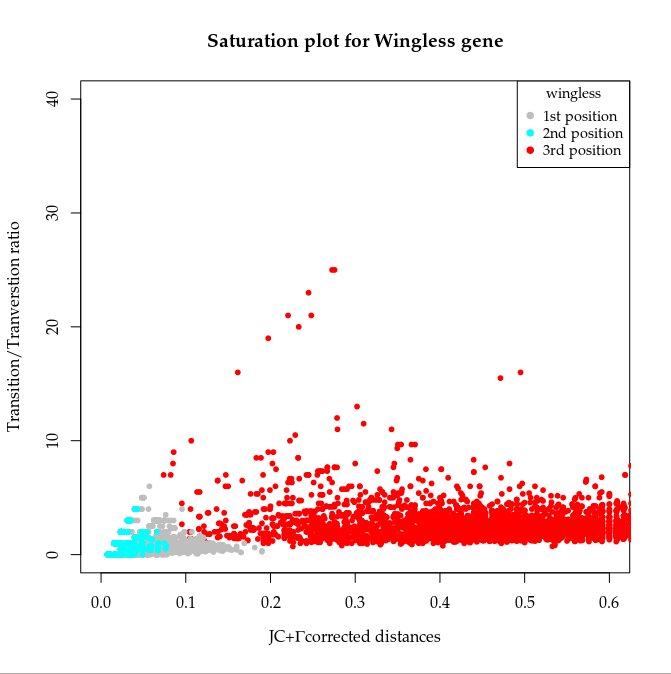 |
Es importante el orden al plotear los puntos (primero los más abundantes).
Así es posible ver todos. |

